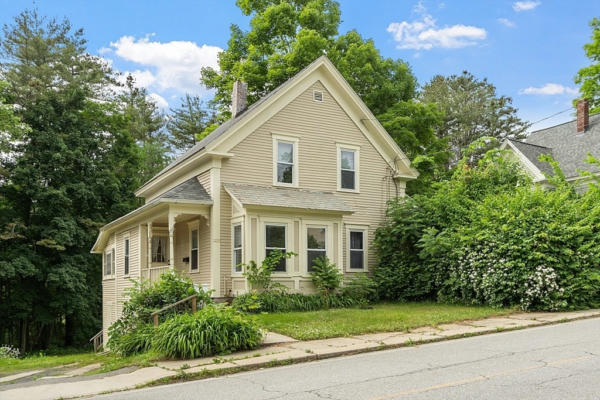
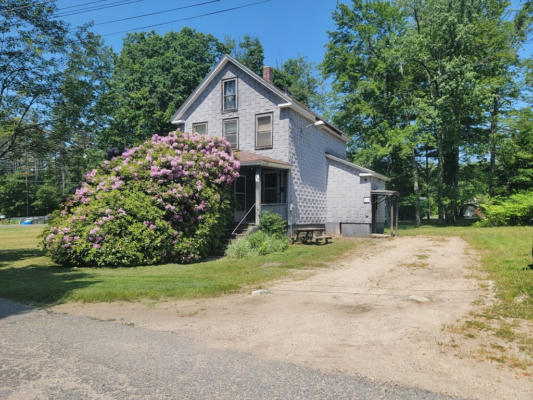
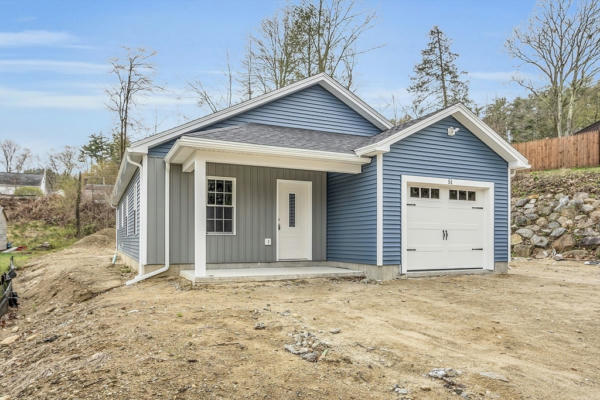
233 N MAIN ST, ORANGE, MA 01364
$269,900
3Beds
1Baths
1,280Sq Ft
Listing by LAER Realty Partners – Hometown Team
Sort:
Use arrows to control slideshow
New Listing
3Beds
1Baths
1,280Sq Ft
New Listing
Updated
-Beds
0Baths
N/ASq Ft
Use arrows to control slideshow
New Listing
2Beds
2Baths
2,029Sq Ft
Use arrows to control slideshow
Under Contract
New Listing
3Beds
2Baths
1,694Sq Ft
Use arrows to control slideshow
New Listing
3Beds
2Baths
1,136Sq Ft
Use arrows to control slideshow
New Listing
3Beds
1Baths
1,068Sq Ft
Use arrows to control slideshow
New Listing
3Beds
2Baths
1,536Sq Ft

Use arrows to control slideshow
New Listing
Updated
-Beds
0Baths
N/ASq Ft
Use arrows to control slideshow
Under Contract
Updated
4Beds
2Baths
2,864Sq Ft
Use arrows to control slideshow
2Beds
2Baths
1,683Sq Ft
Use arrows to control slideshow
Updated
4Beds
2Baths
1,960Sq Ft
-Beds
0Baths
N/ASq Ft
Use arrows to control slideshow
4Beds
1Baths
1,424Sq Ft

Use arrows to control slideshow
3Beds
1Baths
1,587Sq Ft
Use arrows to control slideshow
Updated
2Beds
2Baths
1,300Sq Ft

Use arrows to control slideshow
Updated
-Beds
0Baths
N/ASq Ft
Updated
3Beds
2Baths
1,356Sq Ft
Use arrows to control slideshow
-Beds
0Baths
N/ASq Ft
Use arrows to control slideshow
Updated
-Beds
0Baths
N/ASq Ft

Use arrows to control slideshow
-Beds
0Baths
N/ASq Ft

Use arrows to control slideshow
-Beds
0Baths
N/ASq Ft
| Cities | Total Listings | Avg. List Price |
|---|---|---|
| 1. Boston, MA | 3,924 | $662,045 |
| 2. Cambridge, MA | 490 | $727,651 |
| 3. South Boston, MA | 429 | $476,689 |
| 4. Dorchester, MA | 411 | $204,404 |
| 5. Brookline, MA | 390 | $1,131,173 |
| 6. Barnstable Town, MA | 378 | $1,741,635 |
| 7. Newton, MA | 365 | $1,370,906 |
| 8. Brighton, MA | 356 | $209,008 |
| 9. Somerville, MA | 341 | $627,867 |
| 10. East Boston, MA | 300 | $364,031 |
Total Listings and Average List Price are calculated by RE/MAX, LLC.