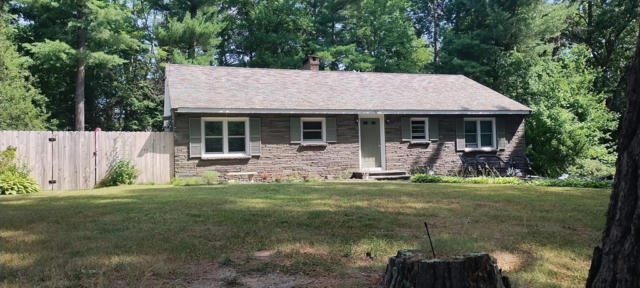
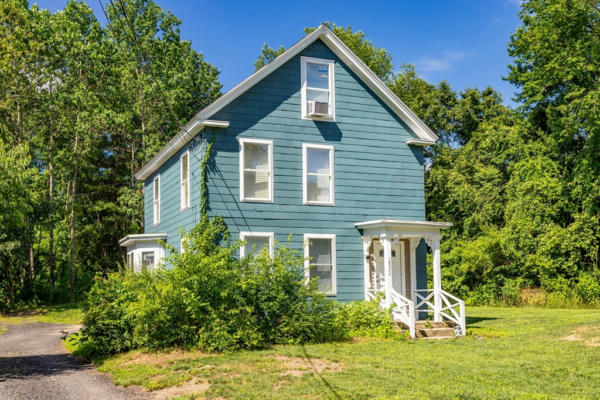
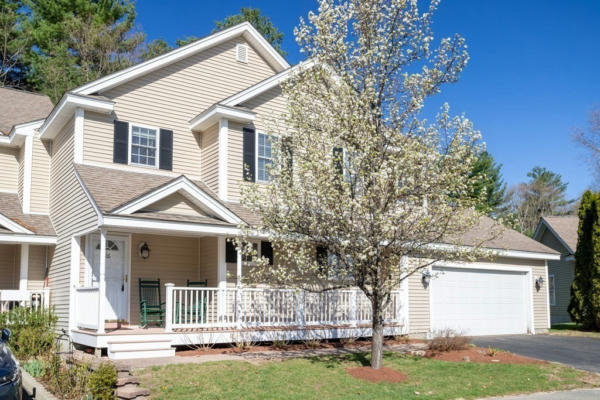
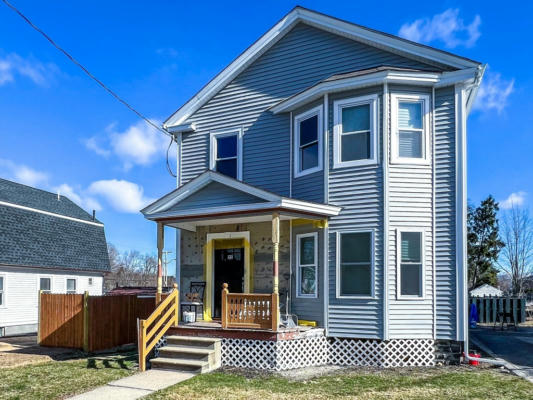
263 STERLING RD, LANCASTER, MA 01523
$529,000
4Beds
3Baths
1,344Sq Ft
Listing by GK Realty – Galen Keller
Sort:
Use arrows to control slideshow
Open House
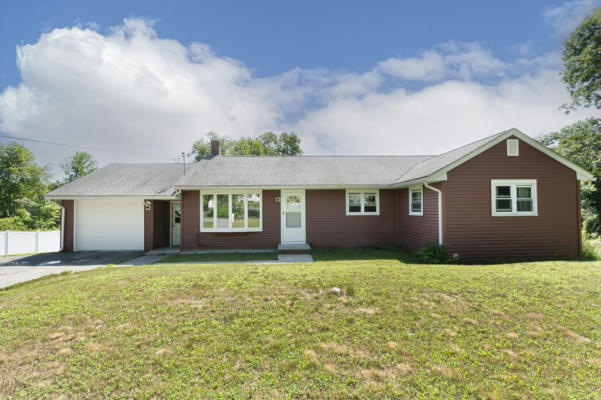
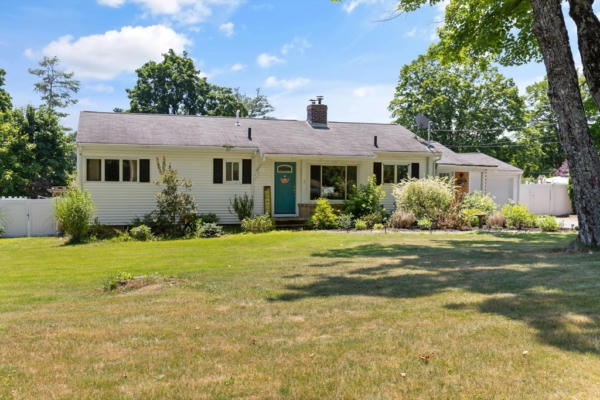
New Listing
4Beds
3Baths
1,344Sq Ft
Use arrows to control slideshow
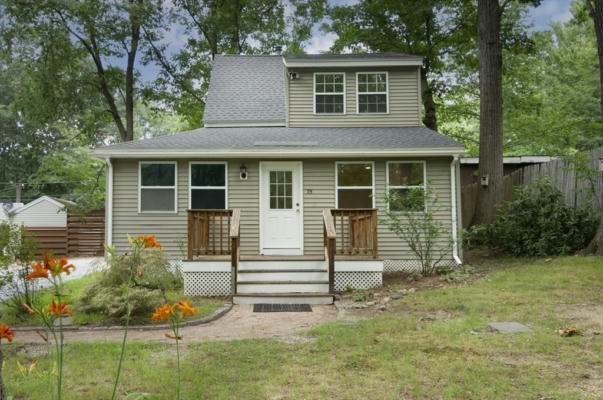
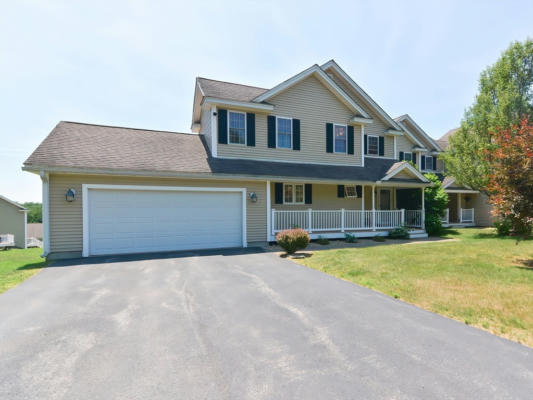
Open House
New Listing
4Beds
2Baths
1,210Sq Ft
Use arrows to control slideshow
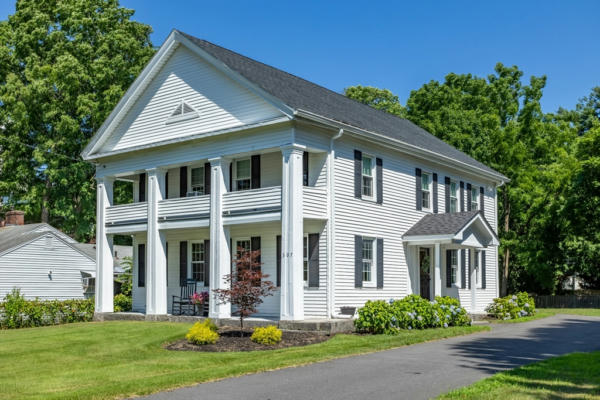
New Listing
2Beds
1Baths
975Sq Ft
Use arrows to control slideshow
Under Contract
New Listing
3Beds
3Baths
2,240Sq Ft
Use arrows to control slideshow
New Listing
4Beds
2Baths
2,000Sq Ft
Use arrows to control slideshow
Under Contract
New Listing
4Beds
2Baths
1,712Sq Ft
Use arrows to control slideshow
2Beds
3Baths
2,056Sq Ft
Use arrows to control slideshow
5Beds
4Baths
3,696Sq Ft

Use arrows to control slideshow
5Beds
4Baths
3,696Sq Ft
Use arrows to control slideshow
Open House
Updated
2Beds
3Baths
1,630Sq Ft
Use arrows to control slideshow
Updated
4Beds
3Baths
3,288Sq Ft
Use arrows to control slideshow
Updated
8Beds
6Baths
2,857Sq Ft
Use arrows to control slideshow
Updated
2Beds
2Baths
1,092Sq Ft

Use arrows to control slideshow
Updated
8Beds
6Baths
2,857Sq Ft
Use arrows to control slideshow
Updated
2Beds
2Baths
1,555Sq Ft
Use arrows to control slideshow
Updated
-Beds
0Baths
N/ASq Ft

Use arrows to control slideshow
-Beds
0Baths
N/ASq Ft
Use arrows to control slideshow
-Beds
0Baths
N/ASq Ft
| Cities | Total Listings | Avg. List Price |
|---|---|---|
| 1. Boston, MA | 3,993 | $580,645 |
| 2. Cambridge, MA | 577 | $485,442 |
| 3. South Boston, MA | 461 | $400,803 |
| 4. Brookline, MA | 406 | $1,018,130 |
| 5. Dorchester, MA | 405 | $206,868 |
| 6. Somerville, MA | 385 | $475,710 |
| 7. Barnstable Town, MA | 379 | $1,684,353 |
| 8. Newton, MA | 370 | $1,387,309 |
| 9. Brighton, MA | 363 | $194,375 |
| 10. East Boston, MA | 302 | $330,144 |
Total Listings and Average List Price are calculated by RE/MAX, LLC.